Exploring the Analytics Behind Better Sports Decisions
Eric Bradlow has all the grit and grind of your toughest football linebacker. His equipment of choice? Data and analytics.
As an applied statistician, Dr. Bradlow, a professor of marketing, statistics, education and economics and vice dean of analytics at the Wharton School of the University of Pennsylvania, uses high-powered statistical models to solve problems. Combining math and observed data, these models use statistical assumptions to generate sample data, find patterns and make predictions that help businesspeople make data-driven decisions on everything from the best products to sell, to the optimal marketing messages.
In the business of sports, statistical models have real muscle. Deep data analysis helps with risk assessment and strategy formation on and off the playing field. Dr. Bradlow, who has worked with the Philadelphia Eagles football team, has observed the power of data analytics in player evaluation, on-field calls, injury-prevention, training and, he says, every aspect of sports. It is a tool that all teams, leagues, coaches and scouts are adopting, if not embracing.
“At parties, people ask what I did for the Eagles, and I describe it like this,” said Dr. Bradlow during a conversation on sports analytics with Wharton Dean Erika James. “When the Eagles have five minutes on the clock to make a draft pick and a scout uses their judgment and says, Mr. Lurie [CEO of the Eagles], Mr. Roseman [general manager of the Eagles], we should pick this player. I want [Lurie and Roseman] to be able to look on their screen and say this is what Bradlow’s algorithm says the success of that player will be. And then to go back to that [scout] and say, ‘I want you to know that the data says something different. You have 30 seconds to tell me why the data is saying one thing and your professional judgment is saying something else.’ That is what good managers do. We can’t ignore data. We can’t ignore algorithms. We can’t ignore the predictions. But they are data and information and support tools to help the experts make decisions.”
High school students who attend Wharton Global Youth’s Moneyball Academy and Moneyball Academy: Training Camp are intrigued by this idea of using data to make decisions on the playing field. Sponsored by the Wharton Sports Analytics and Business Initiative (WSABI) and led by Wharton’s Adi Wyner, these summer programs prepare students to be leaders in an increasingly data-driven economy.
With WSABI’s help, Wharton Global Youth asked past Wharton Moneyballers to share their ideas about the power of sports analytics, including insights from their projects that were published in various editions of the Wharton Sports Analytics Student Research Journal.
A common thread: their love of sports, their reverence for data, and their genuine enthusiasm for putting both into practice.

Nate Y. has always been interested in what he calls “the crossroads of math and sports” – like, always. As a kindergartner (so his parents tell him), he would wake up, run to his computer, and check out all his favorite teams’ box scores and game logs on ESPN.
Fast forward about 13 years and Nate, now a high school senior at The Leffell School near Scarsdale, N.Y., has gone deep on statistics in football and baseball, his two favorite sports, and has improved his analysis after learning skills like R programming language for coding during Moneyball Training Camp and Moneyball Academy. “Learning statistics literally transformed my high school experience,” notes Nate, who was accepted early decision to Wharton, where he plans to attend this fall. “My high school doesn’t have a stats class. After my 9th grade summer in Moneyball, I was so fascinated that I had to do more. I self-studied AP Stats as an independent course and then in 10th grade started a football analytics blog with my friend. My Moneyball experience also served as a springboard to further study R and apply it to advanced statistical projects such as creating a lexicon for analyzing emojis in financial discourse on X and creating SIDELINED, an R-Shiny interactive app that empowers others to challenge gender biases in ESPN NCAA basketball journalism.”
While in Moneyball Training Camp, Nate and his three teammates worked on the project Stolen Bases Are Disappearing as Baseball Becomes More Analytical. Using the Lahman dataset of Major League Baseball pitching, hitting and fielding stats, they created a scatter plot between successful steal rates and runs scored. “We found that most times it’s not worth it for players to steal bases,” says Nate.
Nate is more excited to discuss the Moneyball project he tackled the following summer when he and a few classmates rallied around one of their favorite pastimes: fantasy football. “I’m a huge fantasy football player and manage five teams,” says Nate, referring to the game in which participants serve as owners and managers of virtual American football teams. “We wanted to figure out predicting running backs, which is an important position in fantasy football…We ran a multivariate regression model, made our rankings and then we figured out which players our rankings favored compared to Yahoo! and ESPN.” The model helped Nate draft two winning running backs for his fantasy football league.
Nate’s best advice for aspiring analysts: “Find something that generally makes you extremely excited and then bring different disciplines that interest you together. Sports with math ended up being transformative for me.”
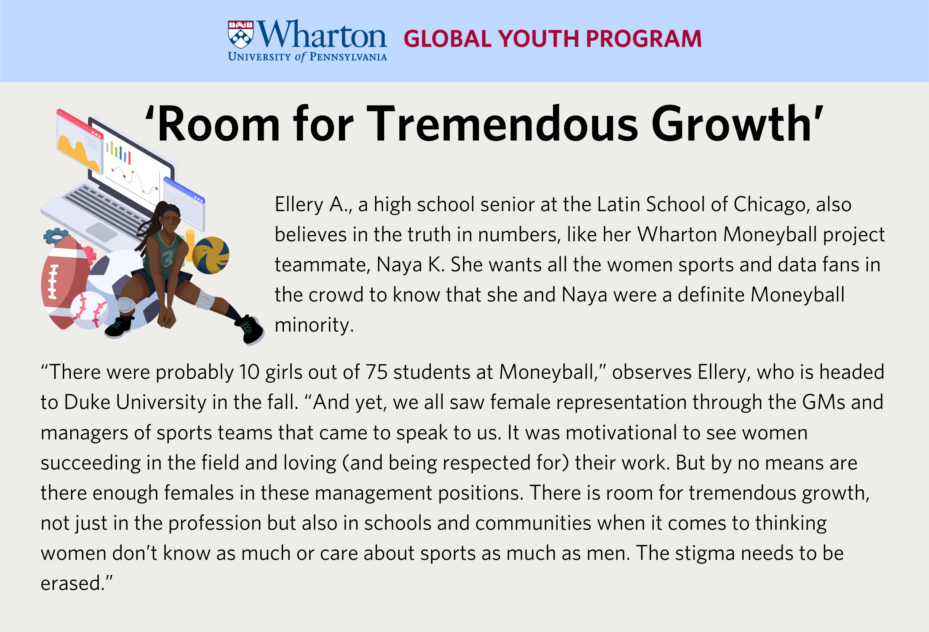
A native of Los Angeles, Calif., Naya K. grew up a sports fan who loved her hometown teams. But when she moved to Fayetteville, Arkansas, she was faced with a challenge: Arkansas has no professional sports teams. “I became a huge fan of college athletics, especially college football,” says Naya, a high school senior at Haas Hall Academy.
So, when Naya ended up at Wharton’s Moneyball Academy the summer before her junior year, she quickly teamed up with her fellow college-football fans to tackle a sports-analytics research project. During brainstorming sessions, they noticed a void in college football rankings: no system existed to evaluate programs on player development. They set out to create a statistical model that ranked programs on their ability to develop players, taking into account high school recruiting rankings and American National Football League (NFL) Draft results.
The group detailed its analytical approach in the paper Stars Matter: An Analysis of College Football Recruiting, Development and Draft Success. “The project was one of the most exhilarating things I’ve been a part of,” recalls Naya, who is working with the University of Arkansas softball team as a data analytics intern. “We pulled data from 24/7 Sports and , Draft results to create a regression model. The regression model showed the predicted NFL Draft result given a player’s high school recruiting ranking. The difference between the predicted and actual draft results we attributed to the player’s development in college. By aggregating the residuals of each college program, we were able to determine which programs were the best at developing their players for the NFL Draft. Using the data, we concluded that The Ohio State was a program that was exemplary at developing their players.”
Naya says she has always been someone who believes in the truth in numbers and appreciates logic and objectivity when making decisions. “In sports, there are so many layers of decisions from recruiting to game strategy to player development,” she observes. “Data analysis is a great way to examine a variety of factors when making these decisions and gain a perspective beyond the traditional way we evaluate sports.”

Ryan W.’s dream job is to be a general manager in the NFL. It’s safe to say that he is making serious strides toward that goal, led by his mantra: passion is the single greatest driver of achievement. And it all started with a stint a few years back in Wharton’s Moneyball. “I didn’t know I had an interest in statistics or sports analytics, but once I got there, I absolutely loved it,” says Ryan, a student at Indiana University’s Kelly School of Business.
During Moneyball Academy, Ryan, then a high school student at Eastside Preparatory School in Seattle, Washington, teamed up with Penn PhD student Ryan Brill to further explore their interest in sports analytics through research. The result: Predicting the Quarterback MVP in the NFL, an analytics project in which the Ryans created a logistic regression model to predict the NFL Quarterback MVP or Most Valuable Player. “The NFL MVP award is chosen each year by a panel of 50 sportswriters who are selected by the Associated Press. As the MVP is chosen by humans who do not necessarily base their decision on statistics, but on watching all the games and talking to coaches and players, it is natural to wonder whether there is a mathematical rule that can describe the MVP selection process.”
Their algorithm predicted the correct quarterback MVP in each year starting in 2003, except 2009 and 2015, when their results pointed to two players whom the popular media agreed were snubbed. It was Ryan’s first opportunity to really go deep on the data. “I had a solid coding background and was able to understand the mathematics of statistics much further working with Ryan Brill,” notes Ryan. More importantly, he connected with Moneyball lecturer Eric Eager, who was then with Pro Football Focus (PFF), a sports analytics company that analyzes the NFL. Ryan got to know Eric so well that he interned at PFF for two years during high school.
All of these data-driven experiences helped to lay the foundation for Ryan’s college career as a finance and business analytics major, which has also included doing analytics for the Indiana football team. “In football specifically, data and film are the two pillars that hold up a football scouting or information program. You have to couple anecdotal evidence with data,” he says. “So, when you see something on the field in football, like when [the other team] runs to the right and a certain linebacker performs much worse at filling that gap, but you’re not sure that is true across all things, you use data to answer that question. Similarly, if you notice a quarterback performs worse against a certain coverage, you watch film to see where exactly he fails. Data is incredibly powerful because it’s concrete information. If done right, it empowers you to make so many more successful decisions.”
Describe Dr. Eric Bradlow’s job as an applied statistician. What does he do and who has he worked for?
Nate’s best advice is to “Find something that generally makes you extremely excited and then bring different disciplines that interest you together.” How might this advice fit into your own interests? How could you make your future pursuits more multi-disciplinary?
Which Moneyball sports-analytics project intrigues you the most? What questions do you have about areas of sports that interest you? How might data and analytics provide clarity?
Sports analytics have changed the whole landscape of all types of sports. From now having to scour statcast to find out who is performing above or below their expectations and predict the future in baseball. To looking at what rate quarterbacks drop back or release the ball quicker and if it affects how they throw. The statistical outlook of sports as opposed to the famous eye test, where most managers like to look at film and judge of that, has become a common battle between the two on which one is more functional. Both principles have gotten very different results. Daryl Morey used analytics as the general manager of the Houston Rockets to maximize the points per possession. He advised them to play in a style where they only shoot 2 point shots if it is a dunk or very close to maximize efficiency. While focusing on three point shots that gain them more points. During his tenure in 2007-2020 he made multiple Western Conference Finals but was never able to make it further. However, he saw a lot of success in the regular season with a win percentage of 62%. The famous eye test also has interesting results.
Ron Rivera is a head coach in the NFL who famously rejects analytics, saying they’re inaccurate because these things vary on different situations. Rivera’s results in the NFL are very mixed with just one notable season in 2015 when he made the Super Bowl with a 15-1 record. They’re also very inconsistent as he’s had seasons in which he was fired or was on the hot seat. Rivera shows an example of how probability is the guide to holding the most consistent results. And the research that is shown throughout the article shows that the future of sports lie’s in the hands of statistician’s with a passion for sports analytics. The project of Naya demonstrates this. Over the years, we’ve seen general managers look at the schools that teams draft players from. Naya estimates the Ohio State is the best developer in terms of football recruits. NFL teams are always inclined to look at the player from Ohio State over the player from a school like Loyola Marymount University. This is just another example of how these projects and analytics show a truth. The effect of knowledge like this can not just affect where an athlete goes to school, but also how a team will consider drafting in the future to not make these mistakes. From the different game plans of Daryl Morey to evaluating players on how fast they hit a baseball or which college they went to, the effects of analytics in sports are showing.
Dear Luiz,
I agree with you that sports statistics should be analyzed and evaluated to avoid more injuries and conflicts or mistakes on the field. As you have mentioned, many coaches of college sport teams have now started to use analytics to determine the overall performance of a player during a certain season and adjust their team according to this. This has helped many teams to maximize their points and to do the most out of their endless hours of training.
Also, as you mentioned later, some coaches believe that this is not useful and players can perform differently on the field than during practice, however, as statistics have shown, most analytics about the performances are correct.
Dr. Bradlow is a professor who incorporates statistics into every aspect of sports with the Philadelphia Eagles, showing that statistics is an integral part of all business decisions, even when there are humans involved. Scouts for the Eagles use their professional judgement to choose players with potential for their team, but those decisions must also be reflected in the data. Everything can be explained by data, even humans, despite our complexities and fluctuations in performance.
In my Sales and Marketing class, our teacher had us watch Moneyball. At first, I didn’t understand how this film about an underdog Major League Baseball team had to do with business until Peter introduces his secret to selecting players – statistics! Data is the driving factor for business decisions. While nobody likes to be quantified by a number on a screen, I believe that human potential can be weighed from statistics. Nate Y. establishes that as baseball becomes more analytical, there are less stolen bases because the data has shown stealing bases isn’t a reliable strategy. In Moneyball, Peter uses statistics to calculate the percentage of individuals getting on base and making runs to score points and ultimately win games. I took AP Statistics this year and understand the complexity behind data and the interpretation of different values. Sports don’t care about throwing form, perceived gracefulness, or judged potential; they focus on the numerical value on the score board to determine victory. People don’t like being quantified as numbers, yet in our world of advanced statistics which can estimate players’ skills, everything can be measured with statistics.
As a student considering sports analytics as a future career, the article reignited the memory that embarked me on my path in this field.
In middle school, my dream was to become a professional baseball player. Since I joined a local baseball team in 2nd grade, I was always one of the hardest-working players on the team. However, it soon became evident that my talent never lived up to my passion, leaving me to spend most of my time on the bench, watching my peers play. Although this distanced me from achieving my dream as a professional athlete, my point of view from the bench shed new light on the field; it enabled me to see things that could only be spotted from an observer’s perspective, enriching my insight into baseball. As I spent more and more time as a bench warmer, eyeing the wins and mistakes of fellow players, my interest in the field of sports analytics grew. I knew my chances of becoming a professional athlete were slim, and I began to see sports analytics as the next best alternative that could keep me connected to the game I love.
After leaving the team in 8th grade, I started studying sports analytics in earnest. I explored books and articles about the foundations of sports analysis. One book I remember reading is called 수학을 품은 야구공 (translation: Mathematics in Baseball) by Donghyun Ko. This book taught me the basic skills of sports analysis, allowing me to elevate my understanding of baseball with a basis of theory, rather than mere experience. I eventually gained enough confidence to open a blog where I actually analyzed real-life games and predicted future outcomes with the models I had studied. At first, my predictions continually turned out to be inaccurate, but I kept chasing the thrill of learning and applying my knowledge.
Nevertheless, despite my high hopes, I kept on failing to build a solid model for the first few months. There were too many factors that my elementary model could not take into account. I started to feel disappointed in myself. Miraculously, after many months and countless attempts, I finally succeeded in making my first solid prediction. It was about a player who had just finished a career-high season. Although major sports news outlets predicted he would be a future superstar based on his batting average, I knew that he was overestimated, judging by his low batted ball speed and high BABIP.In other words, the numbers I crunched showed he was just “lucky”. Reading the article, Nate Y’s experience reminded me of this glorious moment. The mechanism he used, using scatter plots and finding the correlation between the two variables, was exactly what I did to build my successful model. It was truly inspiring to see a fellow student have an experience similar to mine and get closer to achieving a dream we share.
After this experience, I gained confidence in my baseball endeavors and started digging deeper and building various models. Although my blog did not receive much attention, the fact that I made an accurate prediction encouraged me to challenge myself by adding complexity to my models. Each model I built filled me with delight, as it felt like a step closer to my dream in baseball: the dream I failed to grasp with the battered baseball glove I had now overgrown.
Recently, instead of blog writing, I founded a school club with my peers where we use statistics to analyze many aspects of sports including, but not limited to, baseball. It fills me with pride to see my club members build models with a level of robustness that my past models never approached. My club activities constantly fuel me to major in and pursue a career in statistics.
I hope my story and that of Nate, Naya, and Ryan can be a source of motivation for those who feel stuck in their path to their dreams. It is important to be flexible and know that there is never just one way to be involved in your area of interest. As someone who devoted myself to one area for nine years, I understand that there are things we are innately less suited for than others. Looking at the bigger picture showed me an alternative that both suits me better and fulfills my desires.
I like to think that we are undergoing a sports revolution, and this article is a prime example of this movement. Statistical analysis has always been the hallmark of many successful sports stories–from the Oakland A’s famous moneyball to many other lesser known successes. An example of how statistics is changing sports is that there are now rating apps that are becoming increasingly popular, which use a complex algorithm to decide on a scale from 1-10 how well a player is performing in a given match for soccer. Further, statistics are now able to calculate the expected number of goals and assists that a player should have in soccer. I can assess how many goals a player should be scoring, and so can scouts with even more advanced data analysis. This number is extremely significant as it helps people figure out which players are converting goals at an impressive rate compared to those who should be scoring even more, opening up new modes for assessing a performance. This new statistical revolution brings many differing positive and negative viewpoints to the table. On one hand, how can one argue with the cold, hard numbers? However, are our eyes not enough of a metric to be able to tell whether or not a player is performing? Are numbers necessary to tell me that a player is doing well when I can see it? Are all these statistics necessary and favorable? These two ideas are constantly clashing with each other as fans constantly debate the very importance of statistics. Many reject statistics, favoring the classic, yet perennially effective “eye test,” and challenge all statistical assessments that don’t agree with what they see. I feel that eventually, the notion of having an “eye test” will not be completely phased out, but will be instead merged so that both ideas can be effectively used in tandem, as many already begin to do so. The future most likely consists of the “eye test” being that first sign of potential for scouts, and further statistical analysis will lead to a more informed decision.
This new revolution is one that has been long in the making. It is inevitable that new methods for decision making are developed in the realm of sports, but the reaction from fans has been quite divergent. Some fans are able to quickly adapt to the emerging prominence of statistics, and are beginning to look to these ratings as a way to judge the skill and potential of a player as opposed to actually watching matches and forming their own judgment based on what they see. Further, not only are the viewpoints of fans shifting, but many scouts and managers are using these new statistics to form judgments of players, ultimately leading to more informed decisions. In soccer, statistics like expected goals help scouts and managers tell if a player is over performing or not, and if they are scoring at the volume that they should be. Expected goals are furthermore extremely useful in discerning if a player is simply having a really good patch of games, getting lucky with the output they are having, or if they are finishing chances appropriate to the number and quality of chances they are getting. This helps to deduce the true value of a player in the market, and avoid paying a larger fee than there should be. Outside of expected goals, there are a myriad useful aspects of statistical analysis in sports. All the projects that the article mentions are perfect examples of a new phase of sports, and how statistics are leading into a new phase of deeper data analysis. This change is inevitable, and will, over time, certainly improve all sorts of sports. In-depth statistics help viewers gain a deeper understanding of the game, while also helping those who participate in the managing of teams, especially managers. Deeper statistical analysis opens the way for significantly more informed decisions. There is now significantly less guesswork in decisions, and that is an aspect that will be soon phased out almost entirely. This article is a perfect example of this new ongoing revolution, making it an extremely exciting time to be a sports fan, and an even better time to be the manager making the decisions with the wealth of statistics that exist.
Exploring and studying the analytics behind sports decisions has made me a better player. Sports analytics uses data to create strategies and increase the probability of success. Sports analytics is used in many different sports around the world, helping sports teams and players implement strategies to succeed. Ever since childhood, I have been participating in sports and each sport has taught me new things about how people think. Lately, I have seen the analytical side of sports with my coaches and teammates. This helps me become more aware and has led me to implementing new decisions on the field. Sports analytics has allowed me to develop strategies, prevent injury, and improve performance.
Sports analytics has influenced many of the strategies I use today. According to the article, “Deep data analysis helps with risk assessment and strategy formation on and off the playing field” (Drake). This quote explains how sports analytics aids in creating strategies both on and off the field. One of the most important strategies that I have implemented on the field is speed. According to several sports analytics, change of speed in basketball is the most effective way to pass defenders. This offensive strategy allows me to drive to the basket with ease. Apart from creating offensive strategies, sports analytics allows players to determine which defensive strategies are most effective. For example, studying the offensive player’s tendencies allows defenders to determine how to defend. A strategy that I have implemented in my defensive game is forcing players to drive to the left side of the basket. According to sports analytics, right handed players have difficulty making baskets with their left hand. This strategy increases the effectiveness of defense and decreases players’ scoring. Sports analytics in sports has allowed me to create new strategies that are more effective.
Secondly, sports analytics has helped me prevent injury. As stated in the article, “analytics in player evaluation, on-field calls, injury-prevention, training and, he says, every aspect of sports. It is a tool that all teams, leagues, coaches and scouts are adopting, if not embracing” (Drake). According to this quote, sports analytics aids in injury prevention. By monitoring players’ activity, sports analytics helps understand when to avoid overworking. This aspect of sports analytics has impacted me as I was injured for almost two years due to overworked fractures. Soon after, my coaches and I began looking at the analytical side of this injury to prevent it from happening again. In continuation, sports analytics corrects movements that can lead to injuries. Before I began correcting my risky movements on the court, I was constantly injured. I played too aggressively and did quick changes of direction without being careful, all of my movements were not coordinated and I played carelessly. Due to the fact that I was injury prone, I lacked time on the court and missed out on many important games. To resolve this issue, I began using sports analytics to fix movements that created injury and found several alternatives. As a result of this, my physical performance began improving as well. Sports analytics has helped me prevent injury and has led me to become a more reliable player.
In conclusion, sports analytics helps me develop strategies, prevent injury, and improve performance. By analyzing data, I can develop new strategies that are more effective and find ways to prevent injuries. All of these things make me a more reliable player and increases my performance on and off the court. In the end, sports analytics have changed how sports are played and have changed my future in sports.
I found Naya’s story to be extremely inspiring. As someone who also lives in a small town, without professional teams, it’s so interesting to see how this influenced her interests and pursuits. Her project also highlights a cutting-edge way of evaluating sports, that I hope we see more of in the future.
Reading this article reminded me why I first became passionate about sports analytics. It wasn’t just because I loved numbers or strategy. I realized how data could actually help athletes train more intelligently, stay healthier, and make smarter decisions on and off the field.
As a junior tennis athlete in China, I’ve seen how analytics plays a real role in high-level training. At our academy, each of us has a dedicated team that includes a coach, a strength and conditioning trainer, a rehab specialist, and a performance analyst. We use technology every day. Sensors help us track footwork efficiency, high-speed videos break down our serving mechanics, and wearable monitors give us insight into movement load and fatigue. These tools reveal patterns that are hard to notice just by watching. With that information, our coaches adjust drills, manage rest, and tailor feedback in ways that feel personalized and effective.
This kind of support changed how I see training. A few years ago, I spent almost two seasons dealing with overuse injuries. There were long periods when I felt lost, unsure how to move forward without making things worse. That was when I started learning how data could help athletes like me avoid getting injured in the first place. I became curious about how to spot the early warning signs. Eventually, I began working on a machine learning model that analyzes training patterns and recovery data to flag potential risks. It’s still in progress, and I’m constantly adjusting it, but the goal is simple. I want to help more athletes train safely and stay on court longer. If this project can someday be used by coaches and athletes at any level, it will have done its job.
Nate’s project on stolen bases instantly reminded me of my first attempt at building a scatter plot to understand the connection between training hours and injury spikes. That was one of the first times I saw how a chart could bring a story to life. And Ryan’s work on quarterback MVP prediction also stood out to me. It showed how numbers can reveal insights that even experienced coaches might overlook. I felt a real connection to their stories. Like them, I’m trying to use my love of sports to ask questions, explore patterns, and find better answers through analysis.
In just a few days, I’ll be flying to the U.S. to attend the Wharton Moneyball Academy. I’ve been looking forward to this summer for months. I’m excited to meet people from around the world who share this passion, and I can’t wait to work with a team to build a final project we’re proud of. I’m also hoping to improve my R programming skills and gain hands-on experience with real-world datasets. This is a rare opportunity, and I’m ready to learn everything I can from it.
Some people think being an athlete and being a data person don’t go together. But for me, they’ve always been connected. Tennis has taught me how to focus, how to push through, and how to pay attention to details. Data has taught me to question what I see, to look deeper, and to keep testing ideas. Both have shaped the way I approach challenges, whether I’m on the court or in front of a screen.