5 Questions for Katherine Lin: Data Scientist in Training


This story sits at the intersection of challenge and opportunity. First, the pandemic. While a time of crisis, it has also been a year of revealing numbers. Take, for instance, all the data generated from this very unique moment in our world’s history that can help us reflect on various outcomes and better prepare for comparable crises in the future.
That data, in part, helped Katherine Lin turn yet one more COVID-related disappointment into an opportunity. Lin, currently a senior at Byram Hills High School in New York, was preparing last spring to apply to the Wharton Data Science Academy, a summer program that introduces machine learning and data science tools to high school students. When that program was canceled due to the pandemic, Katherine reached out to Program Leader Linda Zhao, a Wharton professor of statistics, to explore possible mentorship prospects.
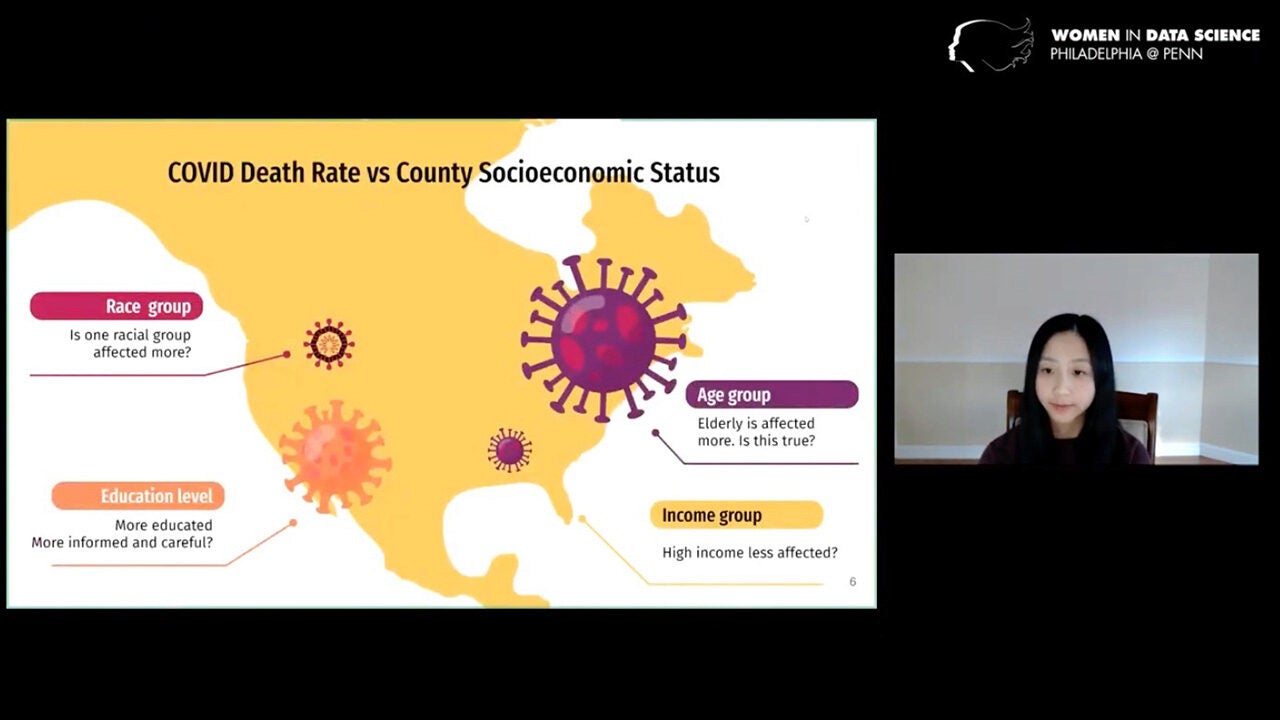
That outreach inspired an immersive data science experience for Katherine that began with her studying statistical machine learning models and R programming language through Zhao’s online “Modern Data Mining” classes, then moving to working virtually alongside Zhao to conduct comprehensive data research on COVID-19 death rates and its impact on counties with different socio-economic characteristics, and finally presenting her findings in February 2021 during the remote Women in Data Science @ Penn Conference. (See Related Links tab for information about Wharton analytics and statistics).
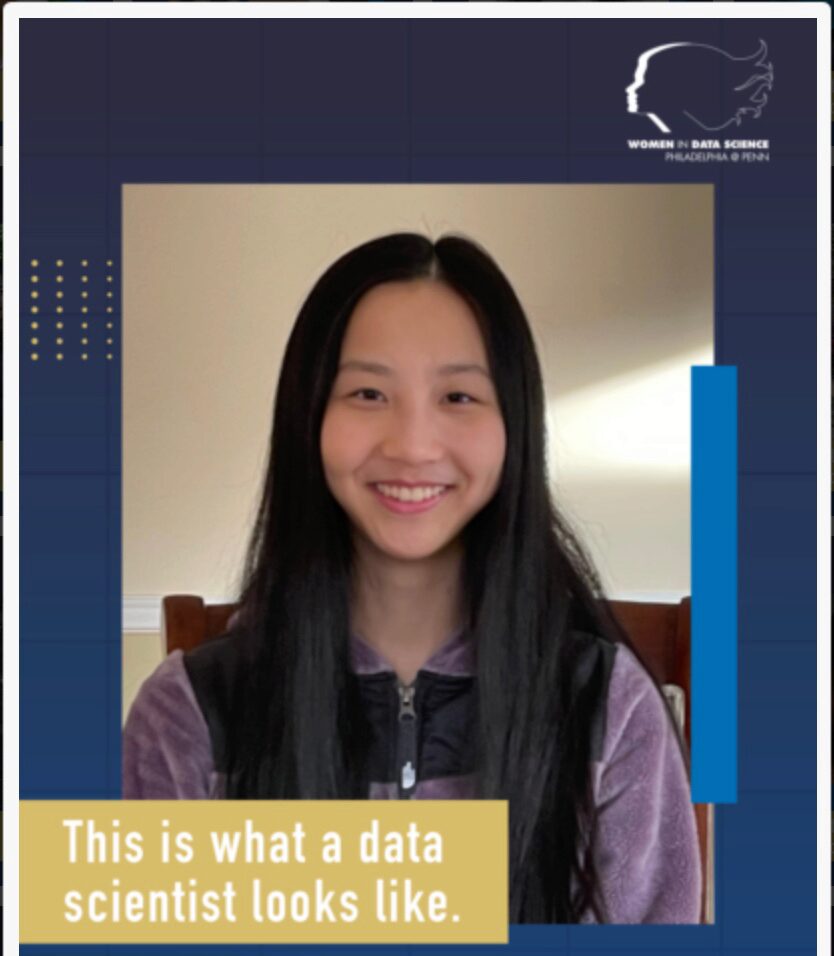
This year’s conference theme – This is What a Data Scientist Looks Like – emphasized the depth, breadth, and diversity of data science, including one particularly well-researched student from Byram Hills High School.

Wharton Global Youth caught up with Katherine to hear more about her data discoveries. “My biggest takeaway from this entire experience is that I want to go into a career where I can do research in data science just because this experience was so rewarding,” says Katherine, who is headed to MIT in the fall. “I was able to get results that meant something and were really relevant. I want to continue that. I want to be able to help people while pursuing my passion for computers and data science.”
Curious about her research project and university collaboration, we asked Katherine for all the details. We give you 5 questions for Katherine Lin:
Wharton Global Youth: How much did you know about data science (a field that uses scientific methods, algorithms and more to extract knowledge and insights from structured and unstructured data) when you first approached Professor Zhao?
Katherine: I took AP Computer Science my sophomore year and now I’m a teaching assistant in that class. I have some Python [programming language] and probability experience. I had to learn a lot, so Professor Zhao sent me her class lectures, which was really helpful. The lectures were set up with both machine learning and R so I could learn both at the same time. It had examples with R code and examples with real data sets, where I could see the different machine learning sets in action. That helped me gain a good understanding of how each of the machine-learning methods worked. We also had short Zoom meetings for me to ask her questions. It took a couple of months.
Wharton Global Youth: What did your research process involve?
Katherine: After I finished learning, I was really excited to just get going and start the analysis. I learned that there is a lot of preparation that goes into it first. I spent a lot of time data-wrangling and cleaning, but once we felt ready to move on to the next step, then Professor Zhao helped me through each of the machine learning methods, writing the code, running it, finding the results. That was my favorite part, being able to see the results. Finally came the writeup. This was definitely the most challenging part for me — putting everything we had together into one cohesive report and finding new ways to display our data. I also had the most guidance from Professor Zhao at this point. She gave me a lot of advice and support on how to format it and write it all up.

Wharton Global Youth: What were some of your key research findings presented in your report, entitled “COVID-19 Impact on Counties with Different Social-Economic Characteristics?”
Katherine: We tried to find the important factors affecting the COVID-19 death rate — for example, is one racial group affected more? And do income level and education level play an important role? There were a lot of media reports about how certain groups were being affected disproportionately [by the pandemic]. I wasn’t sure if they were completely reliable. After seeing this data, it’s definitely true. Some groups do require more support and more resources should be allocated to help those groups, especially during this pandemic, but also in general during times of crisis. Funneling more resources into those groups could help the U.S. overall. (For more report details, watch Katherine’s Women in Data Science presentation, along with research from other students, in the video at the end of this article).
Wharton Global Youth: Do you recall a moment during your research where it all came together for you?
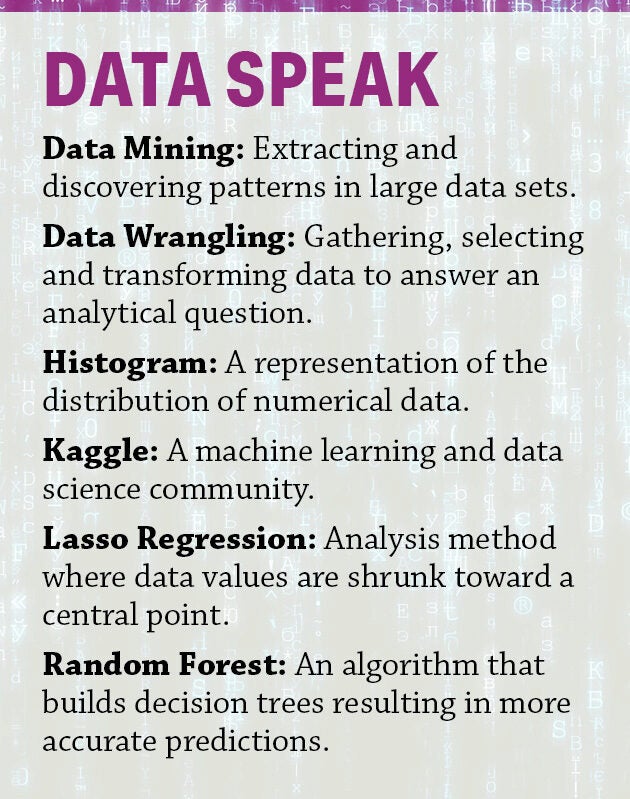
Katherine: I had just finished one type of machine learning method and I was going onto a Random Forest and it was bringing back really good results. I got to pull apart the different variables and see what was going on. I had this moment when I thought, ‘Oh my God, I can see what is affecting the spread of COVID-19 and I can see all the stuff that was hidden before and now it’s out there in the open!’
Wharton Global Youth: What would you like other high school students to understand about data analytics?
Katherine: I wouldn’t say that my research was the most technically complex, but just the fact that I did it and had this experience was the biggest thing. Data is everywhere. With a strong base in analytical thinking and an interest in problem-solving, I would just jump right in. E-mail possible mentors or approach summer programs or take a more exploratory approach looking at data sets on Kaggle. You don’t necessarily have to analyze them using all these complicated techniques, but you can get a basic understanding of how data works so post-high school you can go deeper and study it in college.
Katherine Lin pursued an opportunity during the pandemic. Describe an opportunity that you embraced in the past year, research-related or otherwise. Share your experiences in the comment section of this article.
How are data and decision-making connected, and why is this especially powerful during times of unexpected crisis, like the pandemic?
After finishing this article, explore the resources on the Women in Data Science @ Penn Conference website, which you can find linked in the article, as well as in the Related Links tab. Review another presentation from the conference and share what you learned about data science with your classmates.
“Data is everywhere.” I agree with Katherine Lin’s statement, especially since we now live in a data-driven era, where technology fuels our personal lives, workspaces, and even advances our current scientific understandings. Whether you are googling what time your favorite restaurant opens to what mice prefer more- glucose or fructose- there is always information we can gather through research. Whether you are writing a research paper or formulating a business plan, the purpose of gathering data is to narrow the scope of your topic. Once you have come across your data, you can identify the most important themes that fit best with your project. By researching alongside Professor Zhao, Lin she was able to narrow down the broad topic of COVID-19 into certain factors such as race, income, and education that were affecting the pandemic’s death rate. Lin’s devotion in data science created an opportunity, which she describes in the article, especially for herself to learn, grow, and gather more personal experience with the subject- to understand more than what current news stations relay. Research allows you to use your own perspective to look at performed studies and form your own conclusions rather than hearing it from a potentially biased or flawed secondary source.
During the pandemic, I also pursued a research opportunity where I researched SARS, a topic which I chose primarily to show the precedents of an outbreak similar to COVID-19. I researched SARS’ origin, its vector, multiple nations’ government responses, and how countries were affected by the epidemic both economically and socially to draw parallels between the current circumstances of COVID-19 and SARS. The amount of data and information that appeared when I researched these responses was astounding. During this project, I was able to better understand this certain scope of research, and in addition, I was able to build credibility for myself based on my own beliefs. I drew conclusions by delving deeper into the adverse impacts SARS caused, past many sources that only briefed the surface of the epidemic. In the end, the data I gathered was thoroughly supported after several months of research, which gave me new insights and fed my growing curiosity of medical evolution.
I enjoyed reading the article “5 Questions for Katherine Lin: Data Scientist in Training.” Katherine is inspiring for many reasons: her determination, passion, and curiosity are qualities that I particularly admire in her. During the pandemic, she sought out ways to continue learning as a student and developing as a researcher. From what I understand, Katherine had some background in data science, but not a lot. This did not prevent her from reaching out to Professor Zhao and striving for the research experience she so eagerly desired.
I strongly connected to Katherine’s gratefulness for her mentor because I too have witnessed the impact a great mentor can have. Professor Zhao provided guidance to Katherine through each stage of the model building process as well as for the written report. This year, I joined the electrical group of my FIRST Robotics Competition team. Although I did not know much at the beginning of the year, I kept asking questions and practicing my skills until I got better. The electrical group mentor motivated me throughout and awarded me with the “Most Determined” award at the end of the school year. This experience along with others have motivated me to serve as mentors to others, even if it’s in a small way. For example, I serve as the student outreach leader on my robotics team meaning that I plan and execute community events to increase interest in STEM. I am very interested in inspiring the next cohort of STEM students and leaders!
I was also very excited to hear about the specific data analysis techniques that Katherine used, such as Random Forest, because I have some prior experience with data science. The summer after my freshman year, I worked on a machine learning research paper. This past school year, I took AP Research at school and conducted a year-long data science research project. I performed a meta-analysis which essentially is a statistical analysis of results from previously published papers.
Finally, I was inspired by Katherine’s call to action to readers about how we should take a more exploratory approach to learning. For instance, she suggests that those interested in data science explore datasets on Kaggle. I relate to Katherine because I like to find online data on various topics, especially demographics and sociological data, like poverty and literacy rates analysis. Katherine’s call to action inspired me to continue and expand my exploratory pursuits!